Product Essence: Portable Light Power Measurer
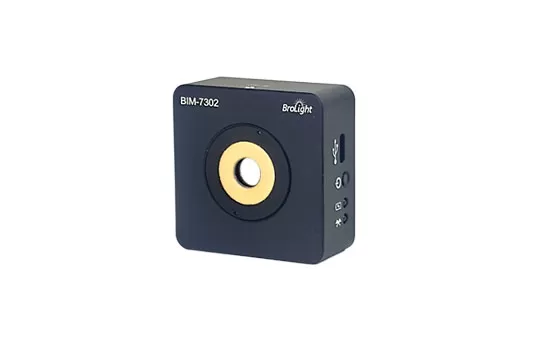
The core value of the BIM-730X series wireless photodiode power meter lies in its wireless + portable design. Weighing only about 100g, with a pocket-friendly size of 55×55×24.5mm, it supports Bluetooth communication and USB Type-C charging and data transfer. Real-time power monitoring can be done via a mobile app or PC software. In scenarios with space constraints, requiring mobile measurements, or needing quick spot checks across different devices, its convenience is unmatched by benchtop power meters.
How to Select: Three Core Decisions
Choosing the right optical power meter requires answering three questions:
What wavelength?
How large is the spot?
How intense is the light?
Decision 1: Choose Detector Material by Wavelength – Addressing “Can it detect the light?”
This is the most critical step. Different detector materials vary significantly in their responsivity to different wavelengths.
Model | Detector Material | Wavelength Range | Application Scenario |
BIM-7301 | Si | 380-1100nm | Routine visible, NIR measurements |
BIM-7302 | Si-UV (UV-enhanced) | 200-1100nm | Applications involving UV bands |
BIM-7303 | InGaAs | 800-1650nm | NIR communication, fiber sensing |
Quick Selection Guide:
Measuring 532nm green light, 632.8nm He-Ne laser, white LED → BIM-7301
Measuring 266nm, 355nm UV laser or UV LED → BIM-7302
Measuring 980nm, 1310nm, 1550nm fiber communication bands → BIM-7303
Decision 2: Choose Detector by Active Area Size – Addressing “Can the spot hit the target?”
This is a crucial yet often overlooked parameter. The effective photosensitive area of the detector is limited. If your spot is larger than this area, part of the light energy won’t be measured, leading to low readings. Spot misalignment will also cause measurement errors.
Model | Detector Diameter | Application Scenario |
BIM-7301/7302 | Φ10 mm | Collimated laser beams, fiber output lights, larger spots |
BIM-7303 | Φ3.0 mm | NIR lasers, narrow beams |
Key Tips:
Ensure the spot falls completely within the detector diameter. For typical lasers, spots are small (1-5mm), and the Φ10mm detector provides plenty of margin.
The BIM-7303 (InGaAs) has a smaller 3mm diameter. Pay special attention to alignment and spot size control; using a fiber flange or fixture is recommended.
For divergent sources (LEDs, unfocused broadband lights), check the spot size. If it’s large, consider increasing the measurement distance to reduce the spot on the detector, or select a large-area detector, or use an integrating sphere power meter (such as the BIM-740xU series).
Fiber output light: Single-mode fiber output spot diameter is hundreds of µm; multi-mode is tens to hundreds of µm. They can be measured by directly centering on the detector.
Practical Tips: Alignment and Angle Control
For the most accurate measurements, follow these principles:
Principle 1: Ensure the spot center aligns with the detector center.
Before measuring, ensure the beam spot falls completely within the detector’s photosensitive area. The BIM-730X series features a high-sensitivity, integrated photosensitive card (for IR or UV bands) surrounding the active detection area. The key benefits of this design are:
Making Invisible Light “Visible”: When measuring invisible light in the Near-Infrared (IR) or Ultraviolet (UV) bands, the beam illuminates this card, causing it to fluoresce with visible light (typically red or green). This makes the spot’s position and profile instantly visible, dramatically simplifying the alignment process.
Improving Accuracy and Efficiency: By using the card to easily confirm that the spot is fully within the detector area and properly centered before taking a power reading, you avoid low readings caused by misalignment or a partially illuminated detector. It also saves significant time compared to using external IR viewing cards or UV cameras.
For the BIM-7303 (InGaAs, 3mm diameter), even with its smaller active area, the surrounding photosensitive card is equally valuable for confirming that the IR spot falls within the active detection area, ensuring measurement repeatability.
Principle 2: Keep the relative position between the light source and detector fixed.
During measurement, the relative position between the light source and the detector must remain fixed. Any change (detector movement, source vibration, mirror shift) will alter the spot’s incidence position and angle on the detector, leading to inconsistent results.
Practical Tips:
Secure the detector and source using an optical table and magnetic bases.
If measuring the same source multiple times, mark the detector’s position to ensure it’s placed back in the same spot each time.
For fiber measurements, use a fiber flange to fix the fiber end face relative to the detector.
Avoid touching or moving the detector during measurement.
Principle 3: Keep the beam at normal incidence (Most Important!)
The angle of beam incidence significantly affects measurement results. Most photodiode detectors follow Lambert’s Cosine Law: when the beam is not normally incident, the effective receiving area decreases with the cosine of the incident angle, leading to lower readings. This is the cosine error.
Incident Angle | Effective Area Ratio | Measurement Error |
0° (Normal) | 1 | No error (baseline) |
30° | 0.866 | -0.134 |
45° | 0.707 | -0.293 |
60° | 0.5 | -0.5 |
Empirical experience: Cosine error is typically within 5% for incident angles less than 60°, but increases sharply beyond that.
Correct approach:
Ensure the beam is at normal incidence (0°) to the center of the detector’s photosensitive surface.
Align the laser or mirrors during setup.
If optical path constraints prevent normal incidence, be aware that readings will be low, and assess if the error is acceptable.
Principle 4: Special handling for divergent beams.
For divergent sources (LEDs, fiber outputs), the beam expands with distance. The greater the measurement distance, the larger the spot size, potentially exceeding the detector diameter and causing low readings.
Correct approach:
Minimize the measurement distance, placing the detector close to the source exit to collect the beam before it expands significantly.
For fiber outputs, use a fiber flange to fix the fiber end face relative to the detector.
If the spot still exceeds the detector diameter or measurements are unstable, consider using an integrating sphere accessory. The sphere’s internal diffuse reflections homogenize the beam, allowing accurate total power measurement regardless of spot size or divergence.
Principle 5: Warning on focused spots.
For very small focused spots (tens of µm), while the spot size is not an issue, power density is (see Decision 3). Never direct a focused spot onto the detector.
Decision 3: Assess Power Density – Addressing “Will it burn out or be undetectable?”
A key concept: The core limiting factor is power density (W/cm²), not total power.
Consider a 10mW beam:
Power Capabilities of the BIM-730X Series:
Parameter | Specification | Note |
Max. Avg. Power Density | 10 mW/cm² | Damage threshold; exceeding may cause damage. |
Min. Measurable Power | ~1 nW (typical) | Limited by detector dark current and ambient noise. |
Direct Measurement Range | ~10 mW (without attenuator) | For uniform illumination on Φ10mm area. |
Three-Step Selection Assessment:
Step 1: Calculate your power density.
Power Density (W/cm²) = Optical Power (W) ÷ Spot Area (cm²)
For a circular spot: Area = π × (Spot Radius)²
Step 2: Determine if it’s within safe limits.
Power Density Level | Conclusion | Action |
< 10 mW/cm² | ✅ Safe | Measure directly. |
10 mW/cm² ~ 1 W/cm² | ⚠️ Risk Zone | Use an attenuator or expand the beam. |
> 1 W/cm² | ❌ Dangerous | MUST attenuate; otherwise, detector damage. |
Step 3: Select a matching attenuator if needed.
Attenuator Model | Attenuation Factor | Max. Measurable Power Density (Extended) |
OD1 | 10x | 100 mW/cm² |
OD2 | 100x | 1 W/cm² |
Special Warning – Focused Spots: Laser light focused by a lens creates extremely small spots (µm scale), and power density can easily reach kW/cm² levels. Never directly illuminate any optical power meter’s detection surface with an unfiltered, focused spot.
Correct approach: Measure or place the attenuator before the focusing lens (where the spot is larger) in the optical path, use a high-factor attenuator to bring the power density into a safe range, or directly use a thermal detector like the BIM-7614 series.
Complete Selection Decision Table
Beam Characteristic | Wavelength Range | Power Density | Recommended Solution |
Collimated beam (1-5mm spot) | 380-1100nm | < 10 mW/cm² | BIM-7301/7302 direct measurement |
Collimated beam (1-3mm spot) | 800-1650nm | < 10 mW/cm² | BIM-7303 direct measurement (note 3mm dia.) |
Collimated beam (1-5mm spot) | 200-1650nm (match detector) | 10-100 mW/cm² | Use OD1 attenuator |
Collimated beam (1-5mm spot) | 200-1650nm (match detector) | 0.1-1 W/cm² | Use OD2 attenuator |
Collimated beam (1-5mm spot) | 200-1650nm (match detector) | >1 W/cm² | Select integrating sphere power meter (such as BIM-740xU series) |
Large/Divergent spot | 200-1650nm (match detector) | Calculate case-by-case | Verify spot size vs. detector diameter; may need large-area detector or integrating sphere. |
Focused spot (<0.5mm) | 200-1650nm (match detector) | Extremely high | Direct measurement prohibited; measure before focusing lens or use high-factor attenuation. |
Note: “200-1650nm (match detector)” indicates the solution is valid for the BIM-730X series coverage, but the correct detector model (7301/7302/7303) must be selected based on the specific wavelength.
Typical Application Scenarios
Scenario 1: Daily Laser Output Power Inspection & Maintenance
Laser power decays over time. Regular checks are key to experimental reproducibility. The BIM-730X’s portability allows quick switching between different devices.
Selection Note: Typical laser spots are 1-5mm and power density is often within safe limits. The BIM-730X can be used directly.
Scenario 2: Power Measurements in Space-Constrained Setups
In compact optical tables or enclosed systems, placing a benchtop meter’s detector can be difficult. The BIM-730X’s pocket-sized design fits into small spaces, and the mobile app provides readouts without needing an external meter.
Scenario 3: Fiber Coupling Efficiency Optimization
During fiber alignment and coupling, real-time power monitoring is common. The BIM-730X’s wireless capability allows you to adjust the fiber aligner while watching power changes on a phone.
Selection Note: Fiber output beam divergence is large; place the detector close to the fiber end face to capture all light.
Scenario 4: Temporary Checks During Optical Path Alignment
When building complex optical paths, power is often measured at various nodes to assess loss. The BIM-730X can be placed at different points, and the mobile app reads values without trailing cables.
Selection Note: In paths with focusing optics, measure before the focusing lens to avoid damaging the detector with high power density.
Summary
Choosing an optical power meter? Ask three questions: ① Wavelength range correct? ② Spot fully within the detector diameter? ③ Power density safe? The BIM-7301/7302 have a Φ10mm detector diameter, the BIM-7303 has Φ3.0mm, and the damage threshold is 10 mW/cm². With the right wavelength, spot coverage, and safe power density, it will give you an accurate answer.
Remember: Normal incidence is key to accuracy – oblique incidence causes cosine error and low readings. Fixing relative position ensures repeatability – if the source and detector positions change, results become incomparable. Focused spots are the “killer” of optical power meters – never measure at the focal point.
 EN
EN
 jp
jp  ko
ko  fr
fr  de
de  es
es  tr
tr  ru
ru  pt
pt  ar
ar  vi
vi