Preface
In a wide range of fields like optical communications, LiDAR, industrial processing, medical aesthetics, and beyond — the laser diode (LD) serves as the core light-emitting device, and its performance directly determines the whole system performance. Among all critical parameters, the divergence angle — a key metric that characterizes beam "directivity" — is often the decisive factor affecting coupling efficiency, collimation design, and key index of beam quality.
However, as shown in Figure 1, laser devices vary widely in form—from bare dies and COS (Chip on Submount) , to TO‑packaged devices with lenses. Each form factor places different demands on the test system. Traditional beam profilers are only suitable for LDs with small far‑field divergence angles and cannot handle large divergence devices.
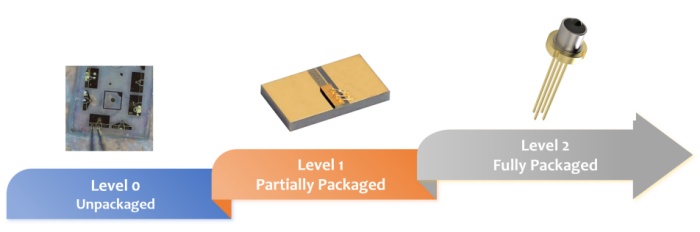
Figure 1: Configurations of light-emitting devices
BRM-6301 Laser Diode Divergence Angle Analyzer from Brolight is an automated testing system specifically designed to address this challenge. Paired with the OPTIED software and a comprehensive product system including drivers, temperature controllers, spectrometers, optical power meters, and fixtures, it provides customers with an integrated optoelectronic testing solution—from individual devices to complete systems.
This article begins with the real pain points faced by the industry, then elaborates on our solutions and the significance of divergence angle data for subsequent applications.
The Real Pain Points in the Optoelectronic Chip and Device Industry
Throughout the entire progress of laser devices—from R&D and pilot production to mass production and reliability verification—engineers frequently encounter the following challenges:
Difficulty in unifying tests for different device types
Note on Array Devices: BRM-6301 Laser Diode Divergence Angle Analyzer divergence angle tester currently does not support batch testing for array-type light-emitting devices (such as VCSEL arrays, Micro-LED arrays, laser bar arrays, etc.). For fin angular characteristic studies on individual chips, single-point testing can be performed by integrating the system with a high-precision probe station and a microscopic imaging system.
Classified by emission mode and packaging level, BRM-6301 Laser Diode Divergence Angle Analyzer covers the following device categories:
Classification | Category | Package Format | Testing Considerations |
Emission Mode | Edge-Emitting Laser (EEL) | Bare die, COS, TO package, Butterfly package | Fast-axis divergence is large (30–40°), requiring full-angle coverage; slow-axis divergence is smaller (10–15°), requiring high angular resolution |
Surface-Emitting Laser (VCSEL) | Single emitter, TO package | Smaller divergence angle (~20–25°), good beam symmetry |
LED | Single chip, COB package | Lambertian emission, broad angular distribution, requiring half-intensity angle measurement |
Packaging Level | Unpackaged (Bare Die) | Bare die | Requires precision probe station for electrical contact and TEC temperature-controlled base for thermal stability |
Partially Packaged (COS) | Chip on Submount | BRM-6701 mounting socket with built-in TEC |
Fully Packaged (TO) | TO-Can (5.6mm/9mm) | BRM-6701 mounting socket, plug-and-play |
Fully Packaged (Butterfly) | Butterfly (14-pin) | BRM-6711 mounting socket with DB9 interface |
Custom Package | User-defined package | Custom fixture service available |
BRM-6301 Laser Diode Divergence Angle Analyzer Advantage: Whether you are testing edge-emitting or surface-emitting devices, at any packaging level from bare die to Butterfly package, BRM-6301, together with the BRM-67xx series temperature-controlled mounting sockets, delivers a plug-and-play, quick-switch testing experience. One platform, all packaging levels – this is the defining value proposition of BRM-6301.
Inability to Measure Large-Divergence Devices
Traditional beam profilers rely on CCD or CMOS imaging principles and are limited by sensor size and optical system design. They can typically only measure emitters with small far-field divergence angles. For large-divergence laser diodes (such as some edge-emitting lasers), traditional methods are simply incapable. Figure 2 illustrates the conventional camera-based measurement scheme.
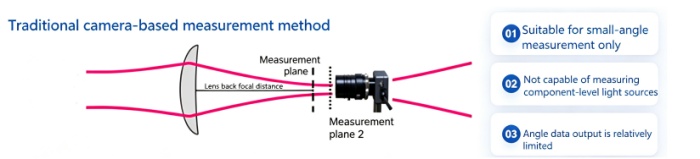
Figure 2: Principle of traditional beam profiler
Incomplete Testing and Data Silos
In many laboratories, divergence angle is measured with one system, while P-I-V curves (power-current-voltage), threshold current, and wall-plug efficiency (WPE) are measured with another. Data cannot be correlated across systems, making it difficult for researchers to understand how temperature and drive current affect divergence angle from a holistic perspective.
Lack of Temperature Control, Poor Test Repeatability
Light-emitting device performance is highly temperature-dependent – wavelength drift coefficient is 0.03–0.1 nm/°C, and divergence angle also varies with temperature. Without precise temperature control, test data lack comparability.
Testing Challenges with Emerging Devices like Micro-LED
With the rapid advancement of display technologies, Micro-LED has gained significant attention as a next-generation display technology. However, the miniaturized nature of Micro-LED presents new testing challenges:
Challenge | Specific Manifestation | Testing Requirement |
Extremely small size | Chip size typically <100μm, some even <10μm | High-precision probe station + microscopic imaging system |
Complex angular characteristics | As chip size decreases, angular emission develops a double-peak profile; significant angular differences among RGB chips | Accurate angular distribution measurement of individual chips |
Color shift issues | Mismatched emission angles of RGB chips cause color shift at different viewing angles | Angle-resolved testing capability to evaluate color deviation |
Special Characteristics of Micro-LED Angular Emission Distribution: Studies show that as Micro-LED chip size decreases, the angular emission profile exhibits a distinct double-peak phenomenon, which is more pronounced in blue and green Micro-LEDs than in red Micro-LEDs of the same size. Additionally, red chips inherently have smaller emission angles than blue/green chips, and encapsulation materials further amplify the emission angles of blue/green light, leading to correlated color temperature (CCT) deviations. These characteristics make divergence angle testing an essential requirement for Micro-LED device evaluation.
Testing Method Note: For single Micro-LED chips, the BRM-6301 Laser Diode Divergence Angle Analyzer can be paired with a high-precision probe station and microscopic imaging system for detailed angular characteristic studies.
Brolight Integrated Photonics Test Solution
BRM-6301 Laser Diode Divergence Angle Analyzer
BRM-6301 Laser Diode Divergence Angle Analyzer is an automated divergence angle analyzer specifically designed for large-divergence laser diodes. Its measurement scheme is shown in Figure 3, addressing the challenge that traditional beam profilers cannot measure large-divergence emitters.
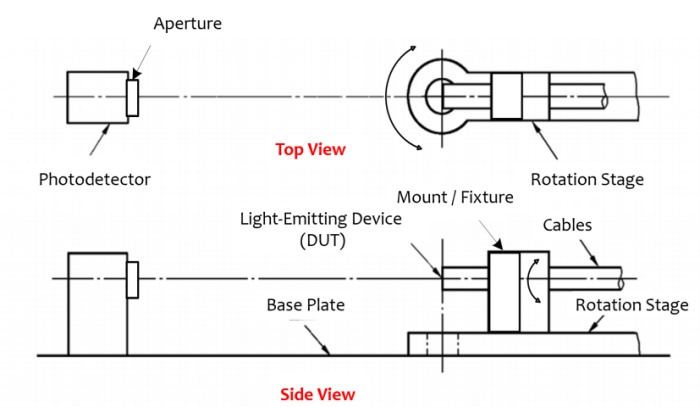
Figure 3: BRM-6301 divergence angle analyzer measurement scheme (Top View & Side View)
Specifications:
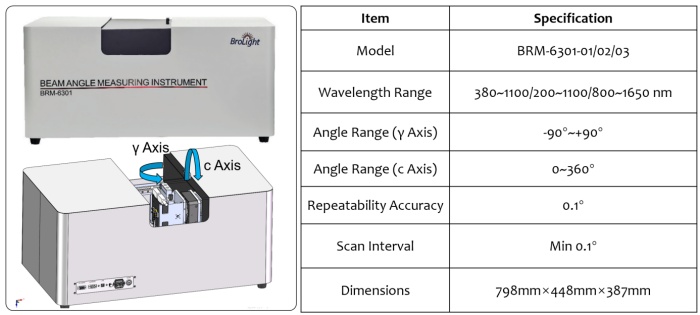
Key Capabilities:
Large-Divergence Measurement: Specifically designed for large-divergence emitters, with no limitation on divergence angle magnitude
Multi-Packaging-Level Adaptability – the defining differentiator: Flexible configuration with detector and mounting socket options tailored to the emitter's wavelength, power, and packaging level – from bare die to Butterfly package, all on one platform
Multiple Output Formats: Supports both polar and Cartesian coordinate angle distribution plots, with automatic half-intensity angle data output
One-Click Report Generation: Automatically compiles measurement data into test report format for easy archiving and customer delivery
LED Compatible: Also suitable for angular distribution measurement of LEDs
Complete Test Ecosystem: Driver, Temperature Controller, and Fixtures Integration
As shown in Figure 4, the BRM-6301 Laser Diode Divergence Angle Analyzer is not an isolated tester but a primary component of Brolight's complete photonics test ecosystem:
Product Series | Model/Series | Function | Significance for Divergence Angle Testing |
Divergence Angle Analyzer | BRM-6301 | Angular distribution measurement | Primary measurement unit |
Laser Driver Controller | BRM-610X Series | Programmable drive current for LD | Simultaneous analysis of P-I-V curves, threshold current, WPE |
TEC Temperature Controller | BRM-620X Series | Precise device temperature control (±0.1°C) | Ensures test repeatability; enables temperature-divergence relationship studies |
Temperature-Controlled Mounting Sockets | BRM-67xx Series | Adapts bare die, COS, TO, and other packaging levels | Plug-and-play, quick packaging-level switching – the foundation of multi-level adaptability |
Spectrometers | BIM-60 Series, BIM-66 Series | Optical emission spectrum measurement | Spectrum-temperature relationship studies; wavelength drift analysis |
Optical Power Meters | BIM-740x Series, BIM-710x Series | Output optical power measurement | Power-temperature relationship studies; thermal efficiency evaluation |
Control & Data Platform | OPTIED | Unified instrument control, data acquisition, and analysis | Breaks data silos; enables correlative analysis across all test parameters |
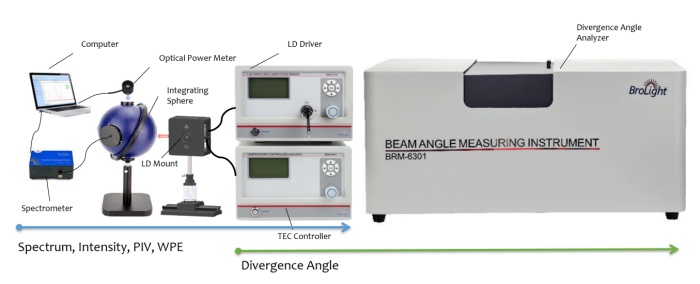
Figure 4: Complete LED/LD photonics characterization test ecosystem
Fixture Adaptation Solutions Across All Packaging Levels
Packaging Level | Recommended Mounting Socket | Temperature Control | Drive Method | Typical Users |
Unpackaged (Bare Die) | Custom probe station fixture | Requires TEC temperature-controlled base | Probe contact | Chip design houses |
Partially Packaged (COS) | BRM-6701 (TO-Can socket) | Built-in TEC, ±0.1°C | Pin contact | Assembly houses, device manufacturers |
Fully Packaged (TO) | BRM-6701 (TO-Can socket) | Built-in TEC, ±0.1°C | Standard pins | Module houses, system integrators |
Fully Packaged (Butterfly) | BRM-6711 (Butterfly socket) | Built-in TEC, ±0.1°C | DB9 interface | Optical transceiver module manufacturers |
Micro-LED Single-Chip Research | Custom high-precision probe station | Requires TEC temperature-controlled base | Probe contact | Display chip R&D institutions |
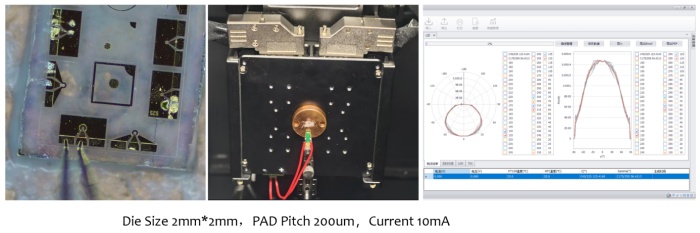
Figure 5: Unpackaged (bare die) testing example
OPTIED Control & Data Platform: The "Central Nervous System" for Instrument Integration
Brolight's OPTIED Control & Data Platform has fully integrated all devices – BRM-6301 divergence angle analyzer, BRM-610X driver controller, BRM-620X temperature controller, BIM-60/66 series spectrometers, and BIM-740x/710x series optical power meters – into a unified ecosystem for instrument control, data acquisition, and correlative analysis. Figure 6 shows a typical OPTIED interface.
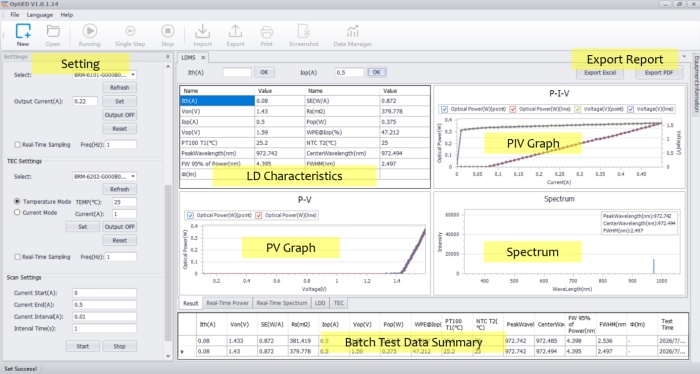
Figure 6: OPTIED Control & Data Platform interface
Researchers can easily obtain:
Divergence angle distribution (polar/Cartesian coordinates) at specific temperatures
Divergence angle trends as a function of drive current
P-I-V curve comparisons at different temperatures
Correlative analysis of divergence angle with threshold current and WPE
Spectrum-temperature relationship curves: Using BIM-60/66 series spectrometers to analyze wavelength drift coefficients and evaluate device thermal stability
Optical power-temperature relationship curves: Using BIM-740x/710x series optical power meters to evaluate temperature impact on output power and optimize thermal management design
One-click export of comprehensive multi-parameter reports
This means: Researchers no longer need to manually export/import data between different software applications. They can directly explore fundamental scientific questions – "How does temperature affect divergence angle?", "How does drive current influence beam quality?", "How does the spectrum drift with temperature?" – all within a single integrated environment.
Significance of Divergence Angle Data for Downstream Applications
Optical Communications – Fiber Coupling Efficiency Optimization
In optical transceiver modules, light emitted from the laser must be efficiently coupled into optical fibers. The divergence angle directly determines the coupling lens design parameters and coupling efficiency.
Application Scenario | Impact of Divergence Angle | Testing Value |
Single-Mode Fiber Coupling | Divergence angle determines collimating lens focal length | Accurately measure divergence angle to optimize lens design and improve coupling efficiency |
Multi-Mode Fiber Coupling | Divergence angle affects numerical aperture (NA) matching | Ensure divergence angle ≤ fiber NA to avoid energy loss |
Silicon Photonics Integration | Spot size matching to waveguide mode field | Provides input parameters for grating coupler or edge coupler design |
Typical Users: Optical transceiver module manufacturers, silicon photonics chip design houses
LiDAR – Far-Field Beam Quality Control
Whether for automotive-grade or industrial-grade LiDAR, beam quality control is an essential consideration. Excessive divergence angle causes far-field spot expansion, reducing optical transmission efficiency, decreasing detection range and resolution, and increasing power consumption.
Application Scenario | Impact of Divergence Angle | Testing Value |
905nm EEL Solution | Edge-emitting lasers have large divergence angles (fast axis 30–40°, slow axis 10–15°) | Accurately measure fast- and slow-axis divergence angles to guide fast-axis collimation (FAC) lens design |
VCSEL Solution | Smaller divergence angle (~20–25°) | Evaluate individual emitter quality; screen for consistent devices |
1550nm Fiber Laser Solution | Fiber output has good beam quality, but seed source still requires screening | Screen seed sources with consistent divergence angles for production uniformity |
Typical Users: LiDAR companies, VCSEL chip suppliers
Laser Pump Sources – Pump Coupling Efficiency Optimization
Semiconductor lasers (LDs) are often used as pump sources for fiber lasers or solid-state lasers. Their divergence angles directly affect the coupling efficiency of pump light into the gain medium.
Application Scenario | Impact of Divergence Angle | Testing Value |
Fiber Laser Pumping | Pump LD divergence affects coupling efficiency into gain fiber | Screen pump sources with consistent divergence angles to improve overall system efficiency |
Solid-State Laser Pumping | Pump divergence affects end-pumped mode matching | Optimize pump optical path design to improve optical-to-optical conversion efficiency |
Pump Source Aging Monitoring | Divergence angle may degrade over long-term operation | Periodic divergence angle testing to assess pump source lifetime |
Typical Users: Fiber laser manufacturers, solid-state laser manufacturers
【Technical Background】Mechanisms of Divergence Angle Impact on Pump Coupling Efficiency
Divergence Angle as a Key Factor in Pump Coupling Efficiency
When a semiconductor laser serves as a pump source, the divergence angle of its output beam directly affects the optical coupling efficiency into the pump medium (fiber or laser crystal). Studies show that the numerical aperture angle of multi-mode silica fibers is generally less than 40°; beam divergence exceeding this angle cannot be coupled into the fiber.
Typical Data: By optimizing the divergence angle of the laser diode (LD) perpendicular to the junction plane from 30° to 3–5°, the coupling efficiency with a 200 μm core-diameter fiber can reach over 90%. Accurate measurement of the divergence angle is a prerequisite for optimizing the design of the coupling optical path and improving pump efficiency.
Impact of Divergence Angle on Solid-State Laser Pumping
In LD end-pumped solid-state lasers, the divergence angle of the pump light directly affects the degree of mode matching with the oscillating laser. By optimizing the divergence angle of the pump light, optimal mode matching can be achieved, thereby improving the optical-to-optical conversion efficiency.
Beam Quality Degradation at High-Power Operation
In high-power operation of broad-area semiconductor lasers, waste heat causes thermal lensing effects that significantly increase the slow-axis far-field divergence angle, leading to severe beam quality degradation and reduced pump coupling efficiency. Regular divergence angle testing enables pump source condition monitoring and early warning of performance degradation.
Typical Coupling Efficiency Data
Institute | Application Scenario | Optimized Coupling Efficiency |
Institute of Semiconductors, Chinese Academy of Sciences(2021) | Green LD beam combining & coupling | 93.75% |
Institute of Applied Electronics, CAEP(2022) | 260 W fiber-coupled pump source | 264 W output, electro-optical efficiency 52% |
Bo Baoxue et al.(1999) | 808 nm LD coupled with 200 μm optical fiber | >90% |
Sources: Academic journals including Infrared and Laser Engineering, Chinese Journal of Lasers, High Power Laser and Particle Beams, as well as publicly available literature from research institutions such as the Institute of Semiconductors, Chinese Academy of Sciences, and the China Academy of Engineering Physics (CAEP).
Research on the Temperature-Divergence Angle Relationship in Device Development
In the laser diode chip design stage, the divergence angle is a key parameter for assessing epitaxial layer quality and waveguide architecture. Combined with the BIM-60/66 series spectrometers and BIM-740x/710x series power meters, a thorough evaluation of the device's temperature-dependent performance can be achieved.
Research Topic | Role of Divergence Angle Testing | Companion Equipment |
Temperature Characterization | Measure divergence angle variation at different temperatures | BRM-620X TEC controller + temperature-controlled mounting socket |
Current Dependence Study | Measure divergence angle variation at different drive currents | BRM-610X driver controller |
Spectrum-Temperature Relationship | Measure spectral changes at different temperatures; analyze wavelength drift coefficient | BIM-60/66 series spectrometers |
Power-Temperature Relationship | Measure output power at different temperatures; evaluate thermal stability | BIM-740x/710x series optical power meters |
Aging Reliability | Monitor divergence angle drift during aging | Long-term testing + OPTIED platform data logging |
Batch-to-Batch Consistency | Evaluate production lot variation | Batch testing + statistical data analysis |
Typical Users: Chip design houses, assembly houses, university optoelectronics laboratories
Micro-LED Display – Angular Characteristics and Color Shift Evaluation
In Micro-LED display technology R&D, angular characteristics are a key parameter affecting display quality.
Research Topic | Role of Divergence Angle Testing | Industry Challenge |
RGB Chip Angle Matching | Measure angular distribution of different colors and sizes of Micro-LEDs | Inconsistent emission angles among RGB chips cause color shift |
Encapsulation Process Impact | Evaluate effect of encapsulation materials on angular distribution | Encapsulation enlarges blue/green emission angles, significantly reducing CCT |
Microcavity Effect Study | Measure angular emission variation as chip size decreases | Double-peak phenomenon in small chips affects display uniformity |
Light Extraction Efficiency Optimization | Correlate angular distribution with light extraction efficiency | Increased sidewall emission reduces on-axis intensity |
Application Scenarios:
Micro-LED Display Module R&D: Evaluate angular emission matching of RGB chips of different sizes
Post-Mass-Transfer Inspection: Batch-test emission uniformity of transferred chips
Encapsulation Process Optimization: Evaluate impact of different thickness/materials on emission angle
Typical Users: Micro-LED display chip R&D institutions, panel manufacturers, AR/VR device makers
Testing Method Note: For single Micro-LED chips, the BRM-6301 can be paired with a high-precision probe station and microscopic imaging system for detailed angular characteristic studies.
Comparative Advantages Over Traditional Methods
Aspect | Traditional Beam Profiler | Brolight BRM-6301 System |
Measurement Principle | CCD imaging; limited by sensor size | Rotating device under test; full-angle scanning (device mounted on temperature-controlled socket) |
Large-Divergence Measurement | Not capable (large errors >30°) | Purpose-built; full-angle coverage (-90° to +90°) |
Packaging Level Coverage (Key Differentiator) | Requires custom fixtures for each packaging level | BRM-67xx series sockets support unpackaged/partially packaged/fully packaged devices – one platform for all packaging levels |
Temperature Control | None, or external | BRM-620X TEC controller; ±0.1°C precision |
Drive Capability | Requires external current source | BRM-610X driver controller; programmable current |
Spectral Analysis | Not available | Optional BIM-60/66 series spectrometers for spectrum-temperature analysis |
Optical Power Measurement | Not available | Optional BIM-740x/710x series optical power meters for power-temperature analysis |
Data Correlation | Data silos; manual recording | OPTIED platform unifies instrument control, data acquisition, and correlative analysis |
Output Format | Beam spot image; requires manual interpretation | Polar/Cartesian coordinate plots; automatic half-intensity angle output |
Report Generation | Manual compilation; time-consuming | One-click test report output; automatic archiving |
Operational Complexity | Complex optical alignment | One-click fully automated measurement |
Typical Test Workflow Example
Scenario: Test divergence angle of a COS device at 25°C and 60°C, with correlated P-I-V curve analysis
Step | Operation | Relevant Models | Data Obtained |
1 | Mount COS device in BRM-6701 temperature-controlled socket | BRM-6701 | Device fixation, electrical connection |
2 | Set TEC temperature to 25°C; start test after stabilization | BRM-620X | Temperature stable at 25±0.1°C |
3 | BRM-6301 automatically rotates detector to measure angular distribution | BRM-6301 | Polar/Cartesian coordinate divergence angle plots |
4 | BRM-610X automatically sweeps drive current; records P-I-V | BRM-610X | P-I-V curves, threshold current, WPE |
5 | Raise TEC temperature to 60°C; repeat Steps 3–4 | BRM-620X + OPTIED platform | Divergence angle + P-I-V data at elevated temperature |
6 | OPTIED platform automatically performs correlative analysis | OPTIED integrated platform | Temperature-divergence relationship; temperature-threshold current relationship |
Research Value: Through this workflow, researchers can directly answer fundamental questions such as "By how much does the divergence angle increase when temperature rises by 10°C?" and "How much does the threshold current drift at elevated temperatures?"
Figure 7 shows a measured example of a COS chip.
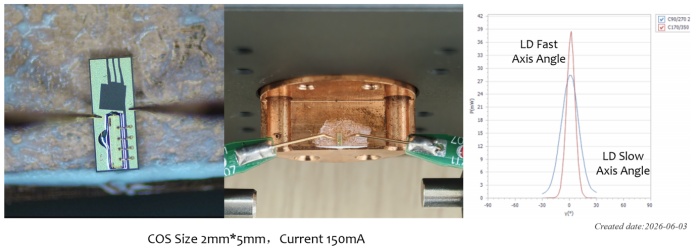
Figure 7: Partially packaged (COS) device testing example
Summary of User Value
For Chip Design Houses
Verify rationality of epitaxial structure and waveguide design
Evaluate batch-to-batch consistency
Provide reliable divergence angle datasheet specifications to downstream customers
For Assembly Houses
Rapid incoming chip screening
Evaluate impact of assembly processes on divergence angle
Provide factory test reports for TO-packaged devices
For Optical Transceiver Module Manufacturers / System Integrators
Accurately measure divergence angle to optimize coupling optical design
Evaluate performance differences among suppliers
Establish incoming inspection standards
For Research Laboratories
Multi-parameter correlative analysis (temperature, current, divergence angle, efficiency)
Integrated test platform improves experimental efficiency
Support custom test sequences for exploratory research
For Micro-LED R&D Institutions
Evaluate angular matching of RGB chips of different sizes
Study impact of encapsulation processes on emission angle
Provide data support for color shift optimization
Commercial LD and LED products are typically characterized by key performance indicators in their datasheets. The Brolight BRM-6301 test platform and supporting ecosystem can completely provide measurement and validation of the following specification parameters:
Parameter | Symbol | Brolight Capability |
Center Wavelength | λ₀ | BIM-60/66 series spectrometers: Measure spectral characteristics at different temperatures/currents; analyze wavelength drift |
Continuous Output Power | P_op | BIM-740x/710x series optical power meters: Accurately measure output optical power |
Threshold Current | I_TH | BRM-610X driver controller + OPTIED platform: Automatically sweep P-I-V curves; extract threshold current |
Operating Current | I_op | BRM-610X driver controller: Record operating current at rated output power |
Operating Voltage | V_op | BRM-610X driver controller: Simultaneously measure device voltage |
Slope Efficiency | η | OPTIED platform: Automatically calculate slope efficiency from P-I curve |
Monitor Current | I_pd | BRM-610X driver controller: Configurable PD monitor channel |
Divergence Angle (Parallel Direction) | θ_∥ | BRM-6301 divergence angle analyzer: Full-angle scanning; automatic half-intensity angle output |
Divergence Angle (Perpendicular Direction) | θ_⊥ | BRM-6301 divergence angle analyzer: Full-angle scanning; automatic half-intensity angle output |
Customer Value: Brolight BRM-6301 test platform is not just a "divergence angle analyzer" – it is a complete test solution covering all key performance parameters of light-emitting devices. From P-I-V curves to spectral characteristics, from divergence angle to temperature dependence – all data is uniformly acquired, correlatively analyzed, and can be exported as a single test report in industry-standard format through the OPTIED platform, ready for use in product datasheet compilation or incoming inspection.
About Brolight
Brolight, an independent brand under A&P Instrument, focuses on the R&D, manufacturing, and integrated solutions of photonics testing equipment and lab instruments. Leveraging A&P Instrument's over 40 years of technological heritage and market expertise in the photonics industry, Brolight precisely addresses the diverse needs of scientific research, industrial inspection, and experimental teaching. With exceptional photonics products and lab instruments, we build a reliable and efficient application foundation for research institutions, industrial enterprises, and educators worldwide.
Contact Us
For more information, technical specifications, or to request a demonstration, please visit our website or contact our sales team. We look forward to supporting your photonics testing needs.
 EN
EN
 jp
jp  ko
ko  fr
fr  de
de  es
es  tr
tr  ru
ru  pt
pt  ar
ar  vi
vi